
When I implement Microsoft Defender for Endpoint (MDE), I occasionally encounter server teams who report that MDE is slowing down their systems. While performance issues can occur in rare cases, in my last deployment, 9 out of 10 of these claims were essentially unfounded the actual cause was usually something else entirely, not MDE.
Performance complaints often stem from misconfigured workloads, outdated hardware, or background processes that compete for resources, rather than the security solution itself. Misinterpretation of monitoring tools or misunderstanding Defender’s behavior can also contribute to these perceptions.
This post aims to guide IT professionals through how to identify, analyze, and troubleshoot performance issues related to Microsoft Defender for Endpoint. I’ll cover practical steps to differentiate between real Defender-induced slowdowns and unrelated system bottlenecks, helping you make informed decisions without unnecessarily disabling critical security protections.
By following these techniques, you’ll gain a clearer understanding of Defender’s impact on your systems, optimize its configuration, and ensure both security and performance coexist smoothly.
The more difficult scenario arises when Real-Time Monitoring consumes a large amount of resources, which is the focus of this blog.
Causes of High CPU Usage
High CPU load from MDE, MDAV can have multiple sources while a scan or realtime monitoring is running/enabled - common reasons include:
1. Unsigned or Untrusted Files
- Unsigned or incorrectly signed EXEs/DLLs trigger deeper scans because Defender cannot trust them.
- Even if an EXE is signed, any unsigned DLLs it loads are still scanned.
- Obfuscated scripts (e.g., PowerShell) require additional analysis and CPU resources.
2. Complex or Misused File Formats
- HTA files or complex formats used like databases can cause more frequent scans.
- Files migrated into databases can also increase load.
3. Continuous Background Actions
- Drivers or processes in endless loops (e.g., a keyboard driver with active debugging → scans every input) cause constant CPU load.
4. Misconfigured Systems
- VDI images sealed too early prevent Defender from building its cache → high CPU at VM startup.
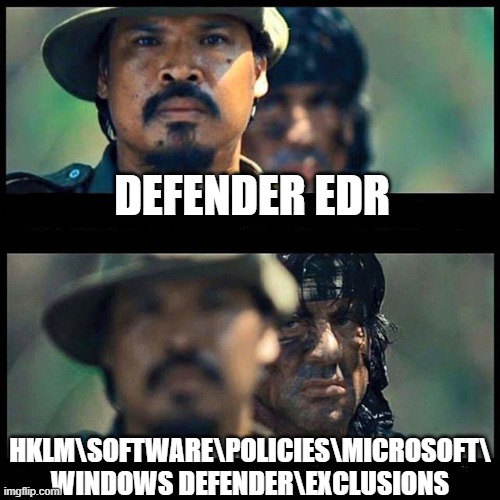
- Incorrect exclusions (e.g., typos in paths) lead to unnecessary scanning.
5. Conflicts with Third-Party Software
- Tools that also monitor I/O or elevate privileges should have mutual exclusions, otherwise CPU usage and scan times increase.
This Microsoft Security Community tech video provides valuable insight into how Microsoft Defender for Endpoint (MDE) operates and explains why the points mentioned above are relevant.
Ways to troubleshoot
- Troubleshooting Mode - Tampering and Testing with different MDE Settings
- Defender Performance Recorder – powerful but complex
- MDEClientAnalyzer – analyzes simple Defender logs
- Process Monitor (ProcMon) – easier for I/O analysis (Not covered in this post, as this is mostly known by most sysadmins)
Troubleshooting Mode
In Microsoft Defender for Endpoint (MDE), Troubleshooting Mode is a powerful feature designed to give administrators temporary flexibility without permanently weakening security controls.

What does Troubleshooting Mode help you with?
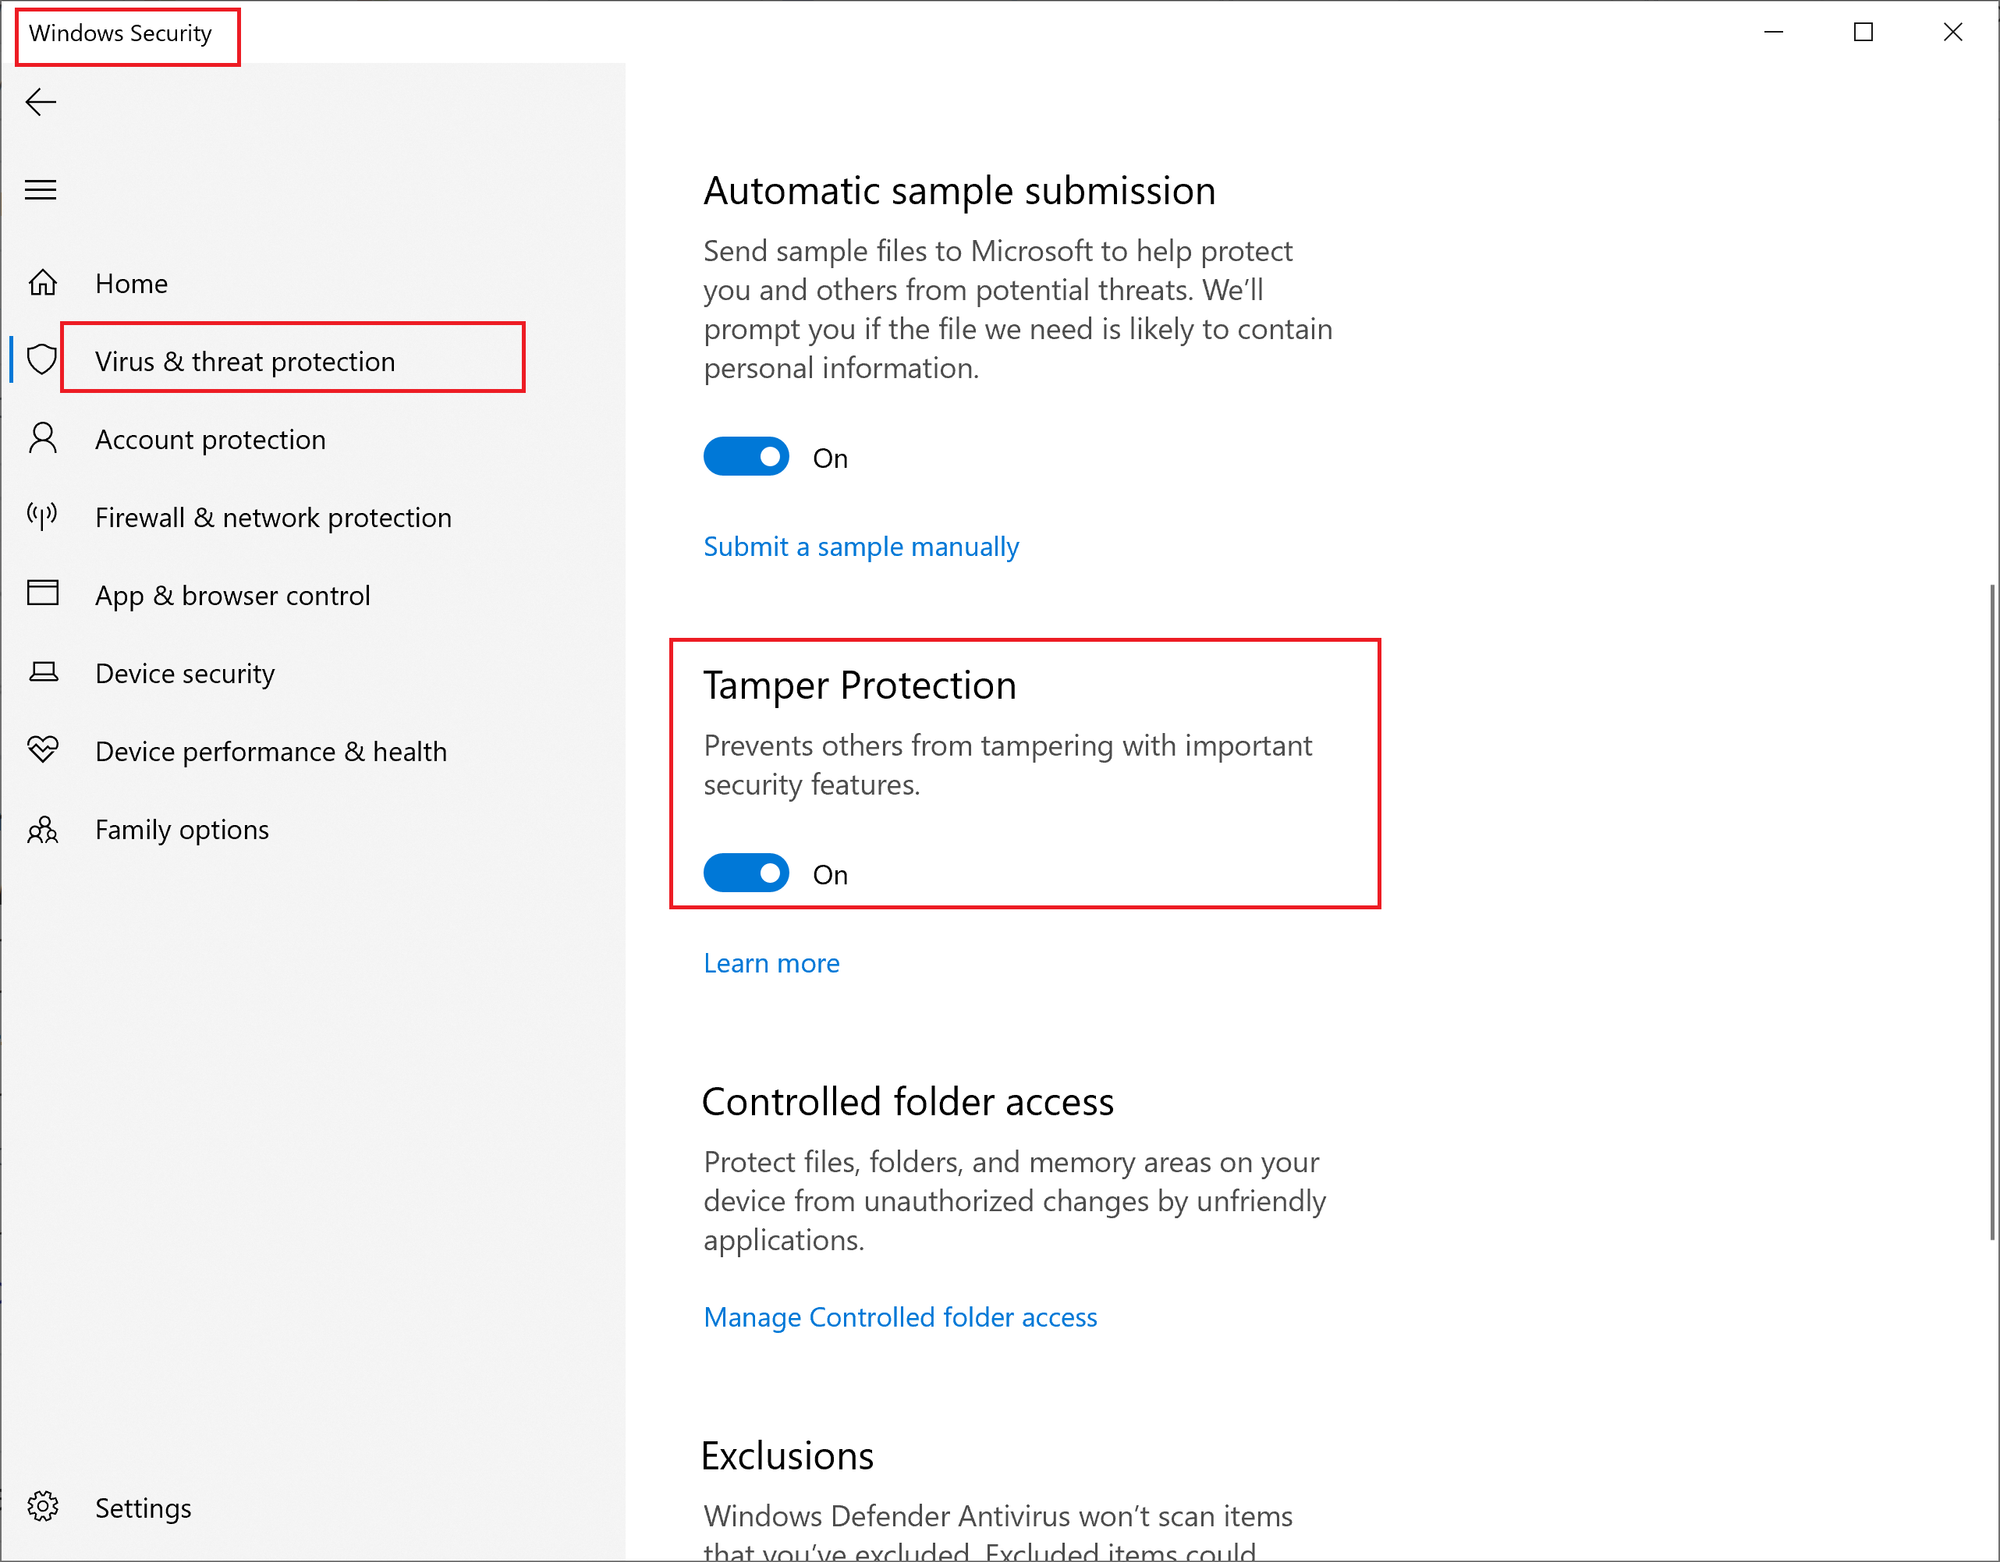
When Tamper Protection is enabled (definitely should be!), critical security settings in Microsoft Defender Antivirus are locked down to prevent unauthorized or malicious changes. That’s where Troubleshooting Mode comes in.
Key benefit
Troubleshooting Mode allows temporary changes to protected settings even when Tamper Protection is enabled by policy - additionally troubleshooting mode resets all changed configurations automatically after 4 hours.
Why this matters
In real-world environments, you may need to:
- Diagnose why a detection is being triggered incorrectly
- Test exclusions or configuration changes
- Investigate conflicts with other security tools
- Validate deployment or policy issues
Normally, Tamper Protection would block these actions.
With Troubleshooting Mode, you can safely bypass those restrictions for a limited time (4 hours), without fully disabling protection:
- Go to the Defender portal (security.microsoft.com) → select the device under Assets.
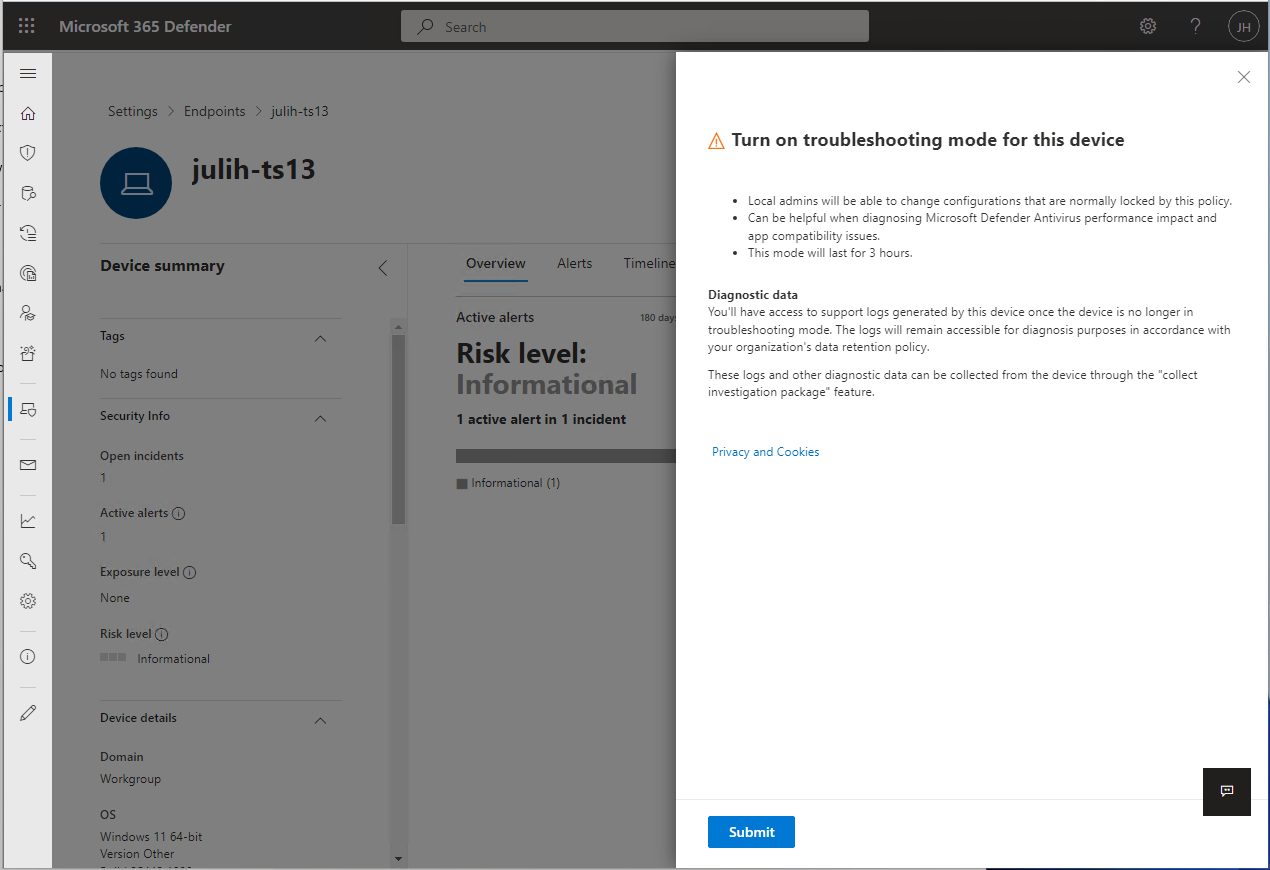
- Click the three dots → Enable Troubleshooting Mode.
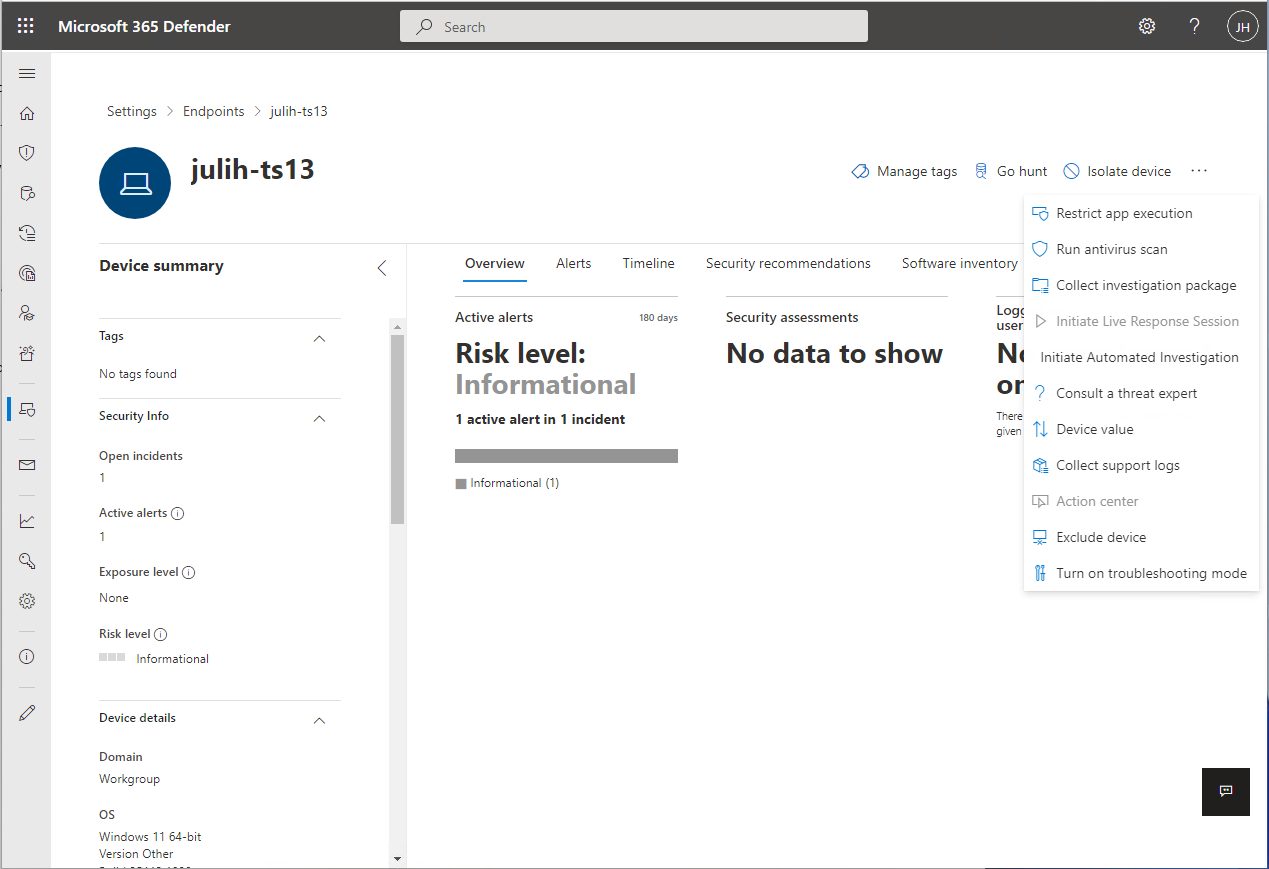
- Settings are temporarily available for 4 hours.
After enabling Troubleshooting Mode, you’ll notice that tamper protection in Defender is no longer greyed out in the settings, or that you can now disable it using a PowerShell command.
Once this is available, proceed to disable tamper protection either via the GUI or through PowerShell. Afterward, you can modify the settings as needed and test your configurations, such as exclusions.
I recommend using PowerShell for making changes during testing, as it provides a more precise and transparent view of the settings and parameters - for example you can now go ahead:
- Set-MPPreference -DisableTamperProtection $true
Useful PS Comands while Troubleshooting after disabling Tamper Protection
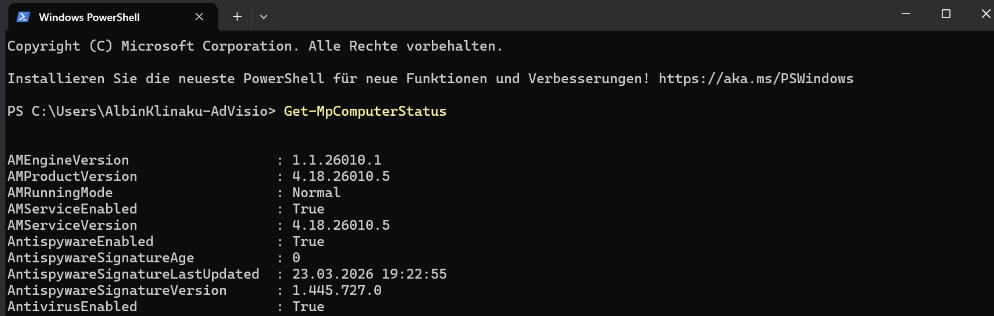
# Check overall MDE/Defender status
Get-MpComputerStatus
# Check current Antivirus and real-time protection settings
Get-MpPreference
# Check active exclusions
Get-MpPreference | Select-Object -Property Exclusion*
# Exclude a folder
Add-MpPreference -ExclusionPath "C:\ExampleFolder"
# Exclude a file
Add-MpPreference -ExclusionProcess "C:\Program Files\ExampleApp\example.exe"
# Exclude a file extension
Add-MpPreference -ExclusionExtension ".log"
# Exclude a process by name
Add-MpPreference -ExclusionProcess "example.exe"
# Remove an exclusion
Remove-MpPreference -ExclusionPath "C:\ExampleFolder"
# Disable real-time monitoring (Behavior Monitoring included)
Set-MpPreference -DisableRealtimeMonitoring $true
# Re-enable real-time monitoring
Set-MpPreference -DisableRealtimeMonitoring $false
# Disable Network Protection
Set-MpPreference -EnableNetworkProtection Disabled
# Re-enable Network Protection (default)
Set-MpPreference -EnableNetworkProtection Enabled
# Disable Controlled Folder Access
Set-MpPreference -EnableControlledFolderAccess Disabled
# Disable Cloud Protection
Set-MpPreference -MAPSReporting Disabled
Set-MpPreference -SubmitSamplesConsent NeverSend
# Disable Script Scanning
Set-MpPreference -DisableScriptScanning $true
Defender for Endpoint collects logs and investigation data throughout the troubleshooting process.
- A snapshot of
MpPreferenceis taken before troubleshooting mode begins. - A second snapshot is taken just before troubleshooting mode expires.
- Operational logs from during troubleshooting mode are also collected.
- Logs and snapshots are collected and are available for an administrator to collect using the Collect investigation package feature on the device page. Microsoft doesn't remove this data from the device until an administrator has collected it.
You can also review the changes in settings that take place during troubleshooting mode in Event Viewer on the device itself.
- Open Event Viewer, and then expand Applications and Services Logs > Microsoft > Windows > Windows Defender, and then select Operational.
- Potential events can include events with IDs 5000, 5001, 5004, 5007 and others. --> Review event logs and error codes to troubleshoot issues with Microsoft Defender Antivirus.
Defender Performance Recording
Defender Performance Recording is a built-in feature of Microsoft Defender that allows you to capture detailed diagnostic and performance data about how the antivirus engine operates on a Windows system.

One of its biggest advantages is that it requires no additional installation everything you need is already included in Windows. Essentially, it works as a performance logger specifically for Defender, tracking activities like scan execution, CPU and memory usage, disk I/O, and how the engine responds to potential threats.
wpr.exe - no errors should appear.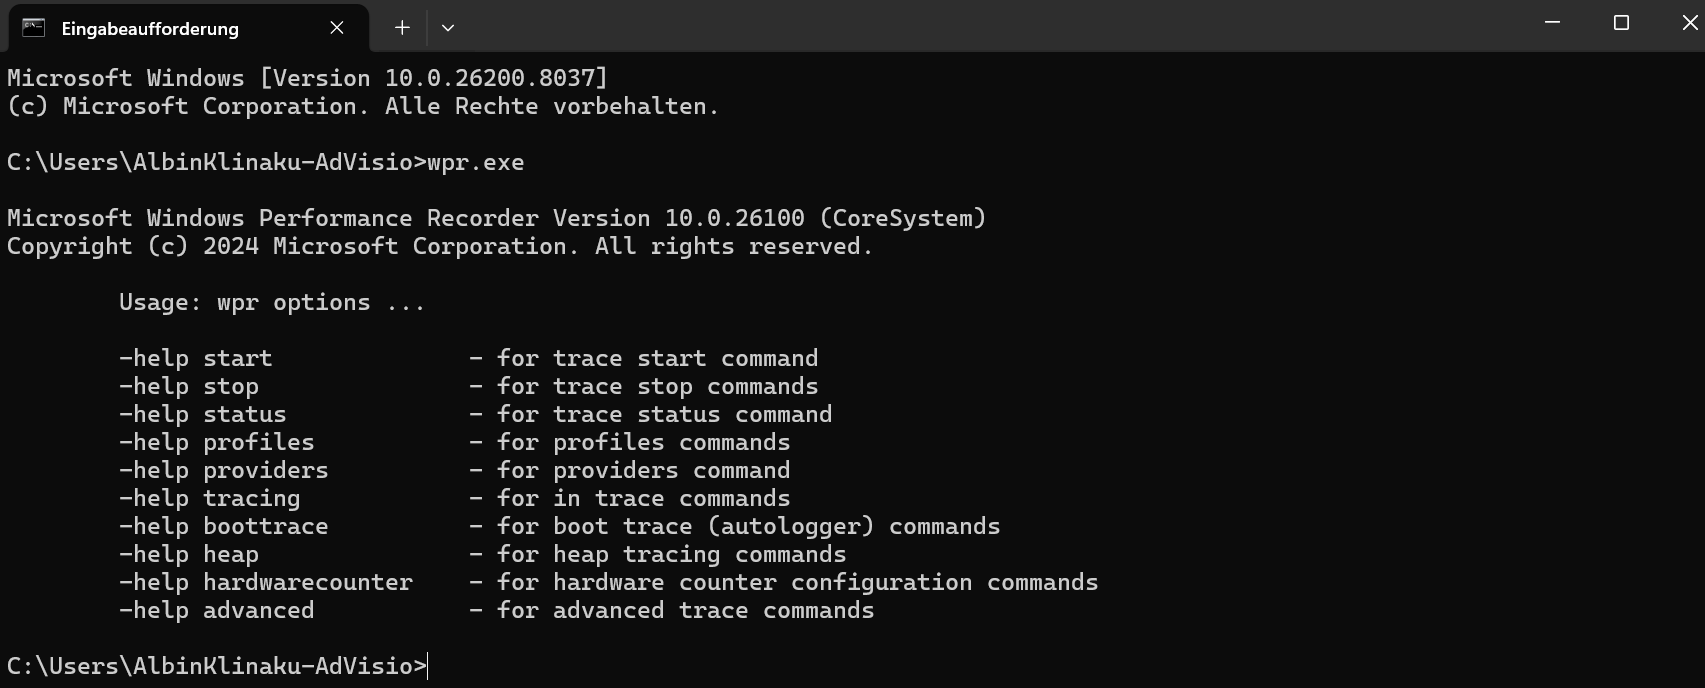
Using PowerShell, managing Defender Performance Recording is straightforward. You can start a recording session with New-MPPerformanceRecording and specify a file path where the recording will be saved, for example C:\Temp\DefenderPerf.etl. After capturing the necessary data, you can stop the session with Enter. The resulting ETL file can then be opened with Windows Performance Analyzer, allowing you to explore CPU, memory, and disk usage in detail, along with Defender’s operational behavior during scans. There are also commands like Get-MPPerformanceReport that let you check the status and details of any active or completed recordings:
# Start recording (Let the recording run for several minutes in the current state)
New-MPPerformanceRecording -RecordTo C:\MPPR\MDE-Rec-25032026.etl
# Stop recording with pressing Enter
# Analyze reports
Get-MPPerformanceReport -Path C:\MPPR\MDE-Rec-250320265.etl -TopProcesses 3
Get-MPPerformanceReport -Path C:\MPPR\MDE-Rec-25032026.etl -TopScans 3
Get-MPPerformanceReport -Path C:\MPPR\MDE-Rec-25032026.etl -TopPaths 3
Get-MPPerformanceReport -Path C:\MPPR\MDE-Rec-25032026.etl -TopFilesPerProcess 5
Get-MPPerformanceReport -Path C:\MPPR\MDE-Rec-25032026.etl -Overview
You can as well combine those commands and/or export them to a CSV:
(Get-MpPerformanceReport -Path .\MDE-Rec-25032026.etl -Topscans 1000).TopScans | Export-CSV -Path .\MDE-Rec-25032026.etl.csv -Encoding UTF8 -NoTypeInformation
While analyzing the report using the powershell comands above try to identify:
- Which Processes/files causing high CPU
- Which Unsigned DLLs or files causing high CPU
- Which paths are frequently scanned
- Which Scan types are triggering the load
This should give you a good insight about what is exactly going on while MDE is onboarded and active on your endpoint while your system and the applications on the systems are running normally/slowly.

In my recent projects, exclusions for On-Premis Exchange 2019 / SE were primarily required, as Microsoft Defender for Endpoint can slow down the Transport services. In such cases, make sure to use Microsoft’s Exchange Team provided script, Set-ExchAVExclusions, to apply the recommended exclusions correctly.

Run the script directly on your Exchange:
.\Set-ExchAVExclusions.ps1 -ListRecommendedExclusions -FileName .\Exclusions.txt
This command gives you all exclusions you should set for your Exchange in a file called Exclusions.txt - You than can use that to set the exclusions via GPO.
w3wp.exe), as this is not best practice; doing so would leave Exchange’s web services such as OWA, ECP, and EWS (and other published Web Apps) vulnerable to malware and bypass Defender’s protection, creating a significant security risk.When talking about exclusions, check out Christopher Brumm and Fabian Bader's Blogs:

MDE Client Analyzer
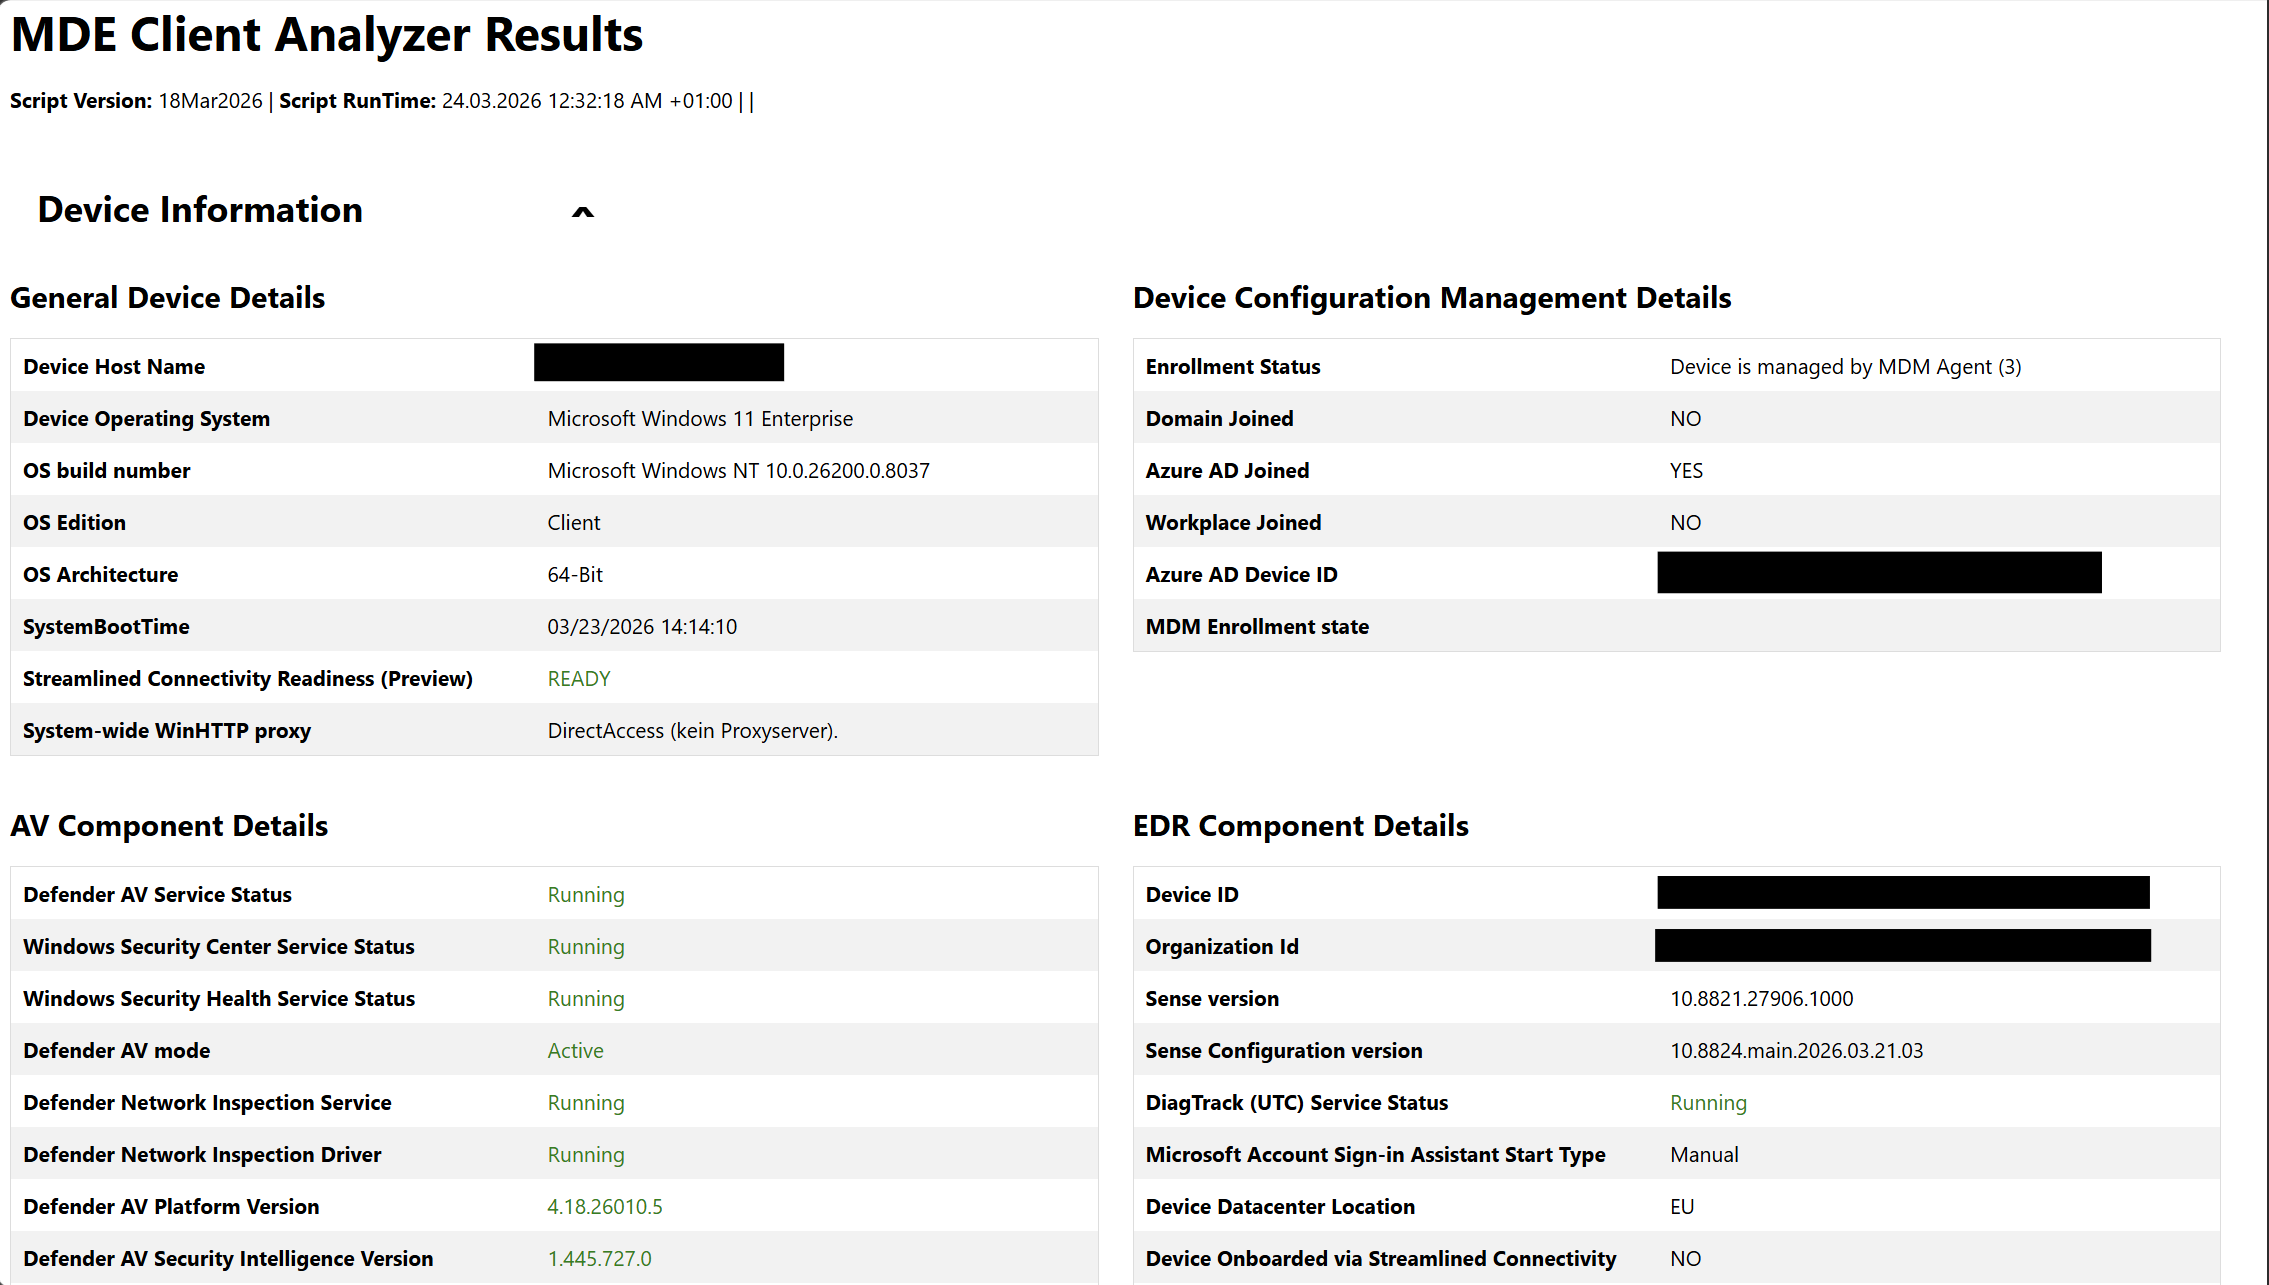
The MDEClientAnalyzer is a built-in tool in Microsoft Defender for Endpoint that helps administrators check the health and configuration of the Defender client on a device. It collects diagnostic data such as service status, antivirus engine versions, updates, scan history, and connectivity to management services and analyzes it to identify misconfigurations, errors, or performance issues.

Running it via PowerShell produces a detailed report highlighting potential problems and suggested fixes, making it an easy way to troubleshoot slow scans, update failures, or other client-side issues. In short, MDEClientAnalyzer is a powerful “health check” for Defender, helping IT teams ensure endpoints are secure and running optimally.
- Download the ZIP from https://aka.ms/MDEClientAnalyzerPreview
- Open a CMD Window with elevated privileges and accept the Licence Agreement
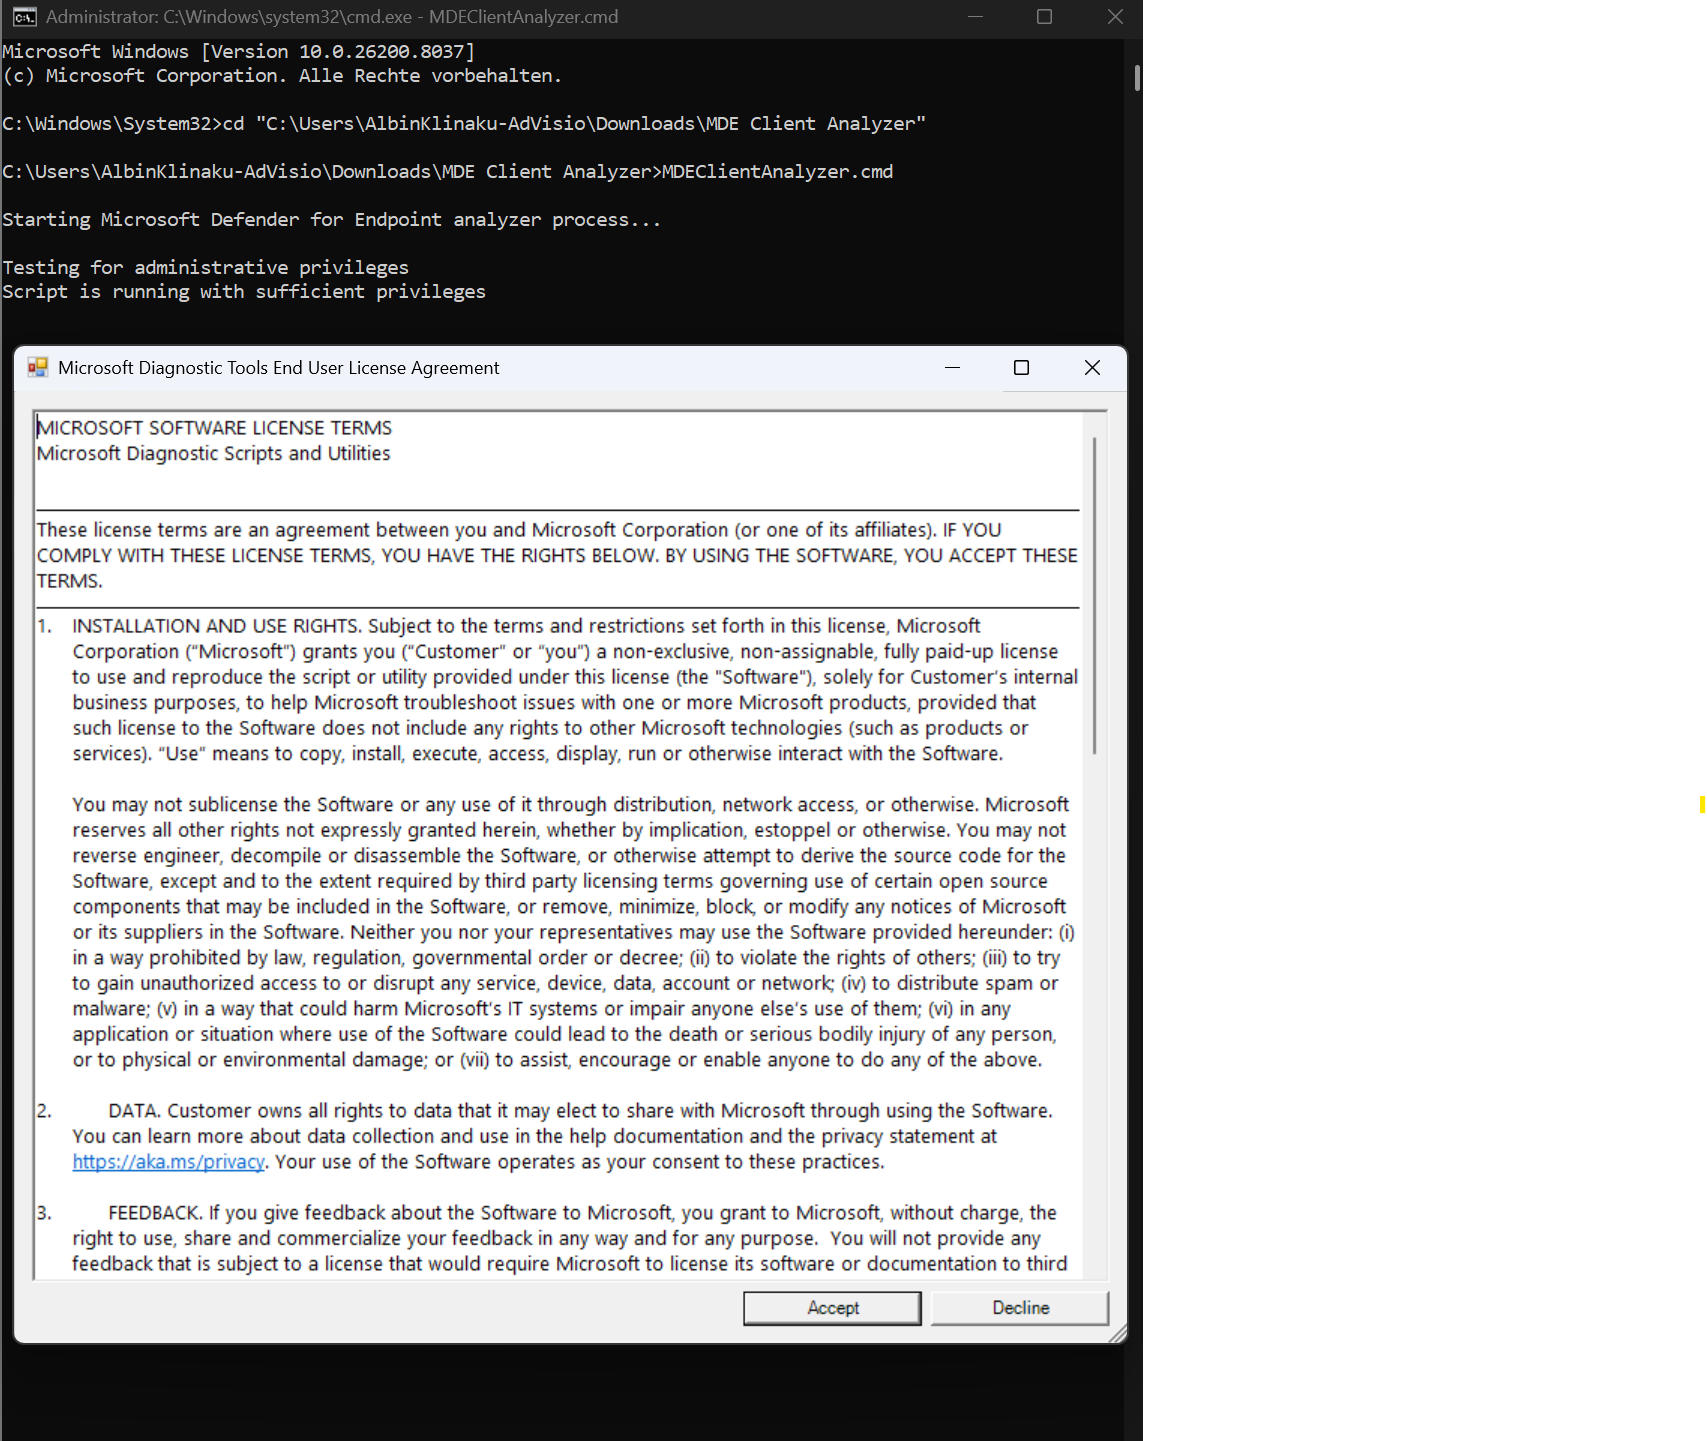
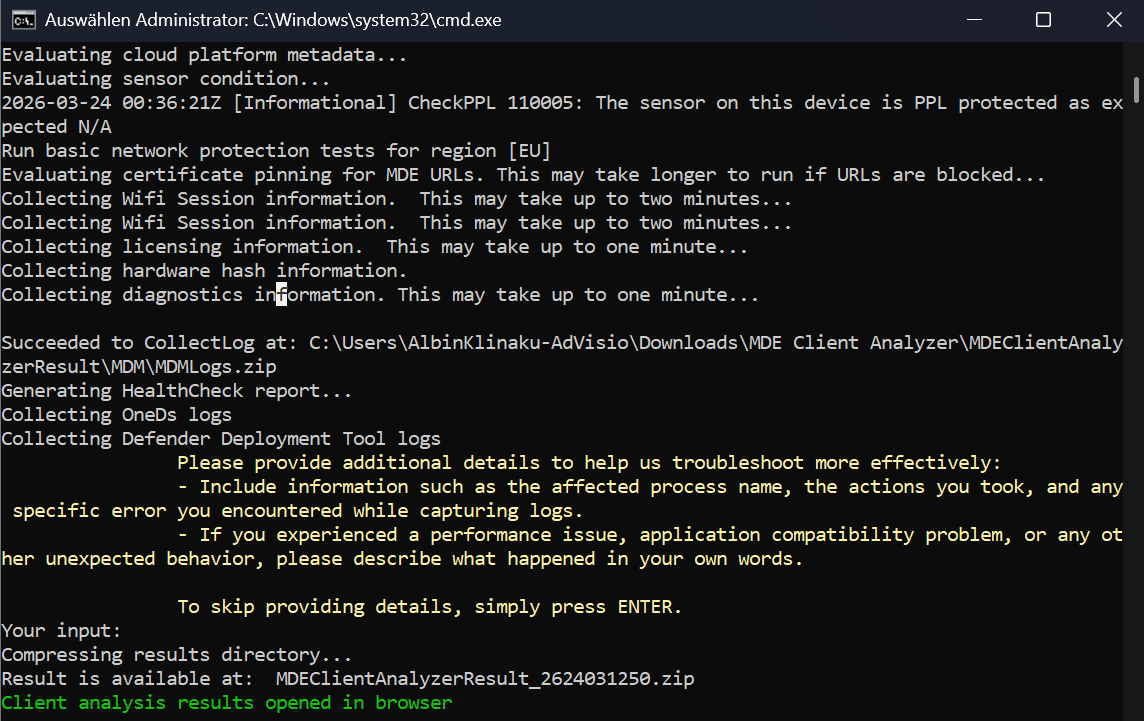
- Run the Script .\MDEClientAnalyzer.cmd and wait until its finished
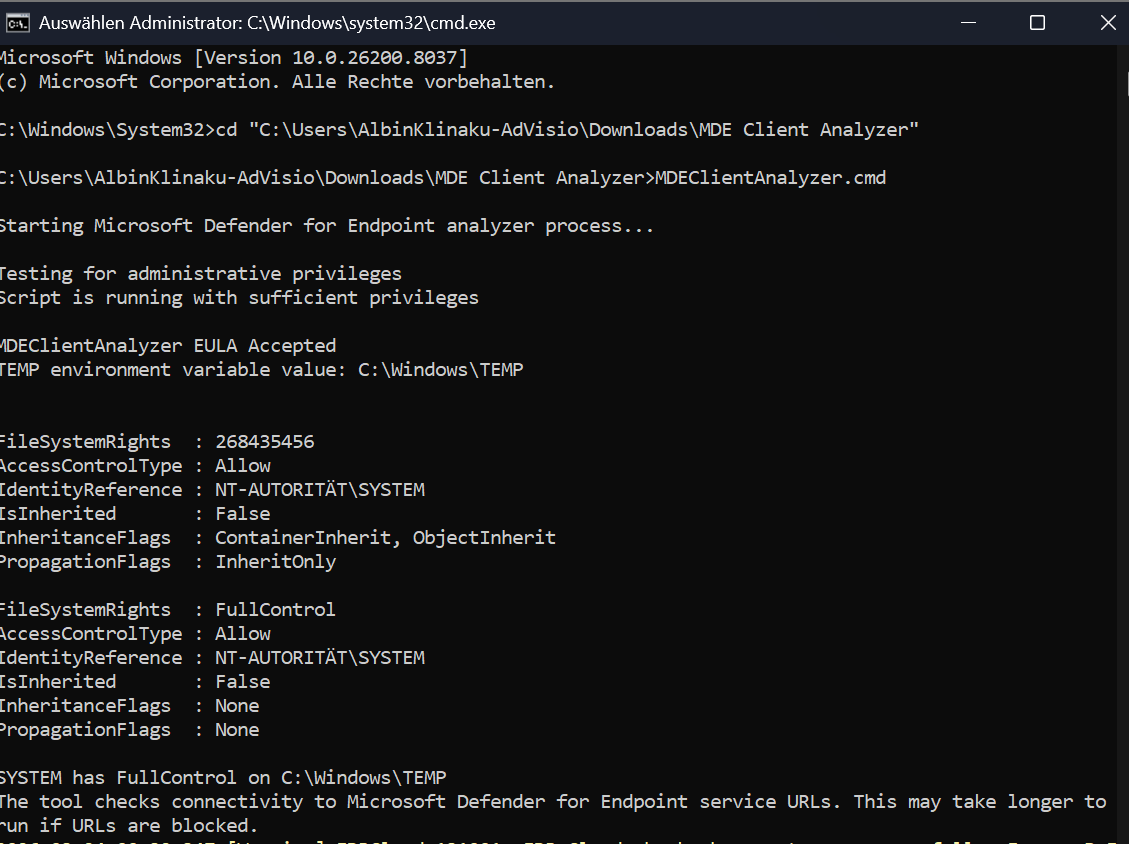
- EDR Cloud checks may fail if PsExec is blocked. Use Live Response to collect logs instead.
- Network Protection or URL Custom Indicators may be unavailable on older platforms or if connectivity is limited.
- ASR rules like “Block process creations from PSExec/WMI” can prevent network validation unless exclusions are set.
- Certificate revocation checks may fail if PsExec is blocked
- After its finished a client analysis results wil automatically open in your browser
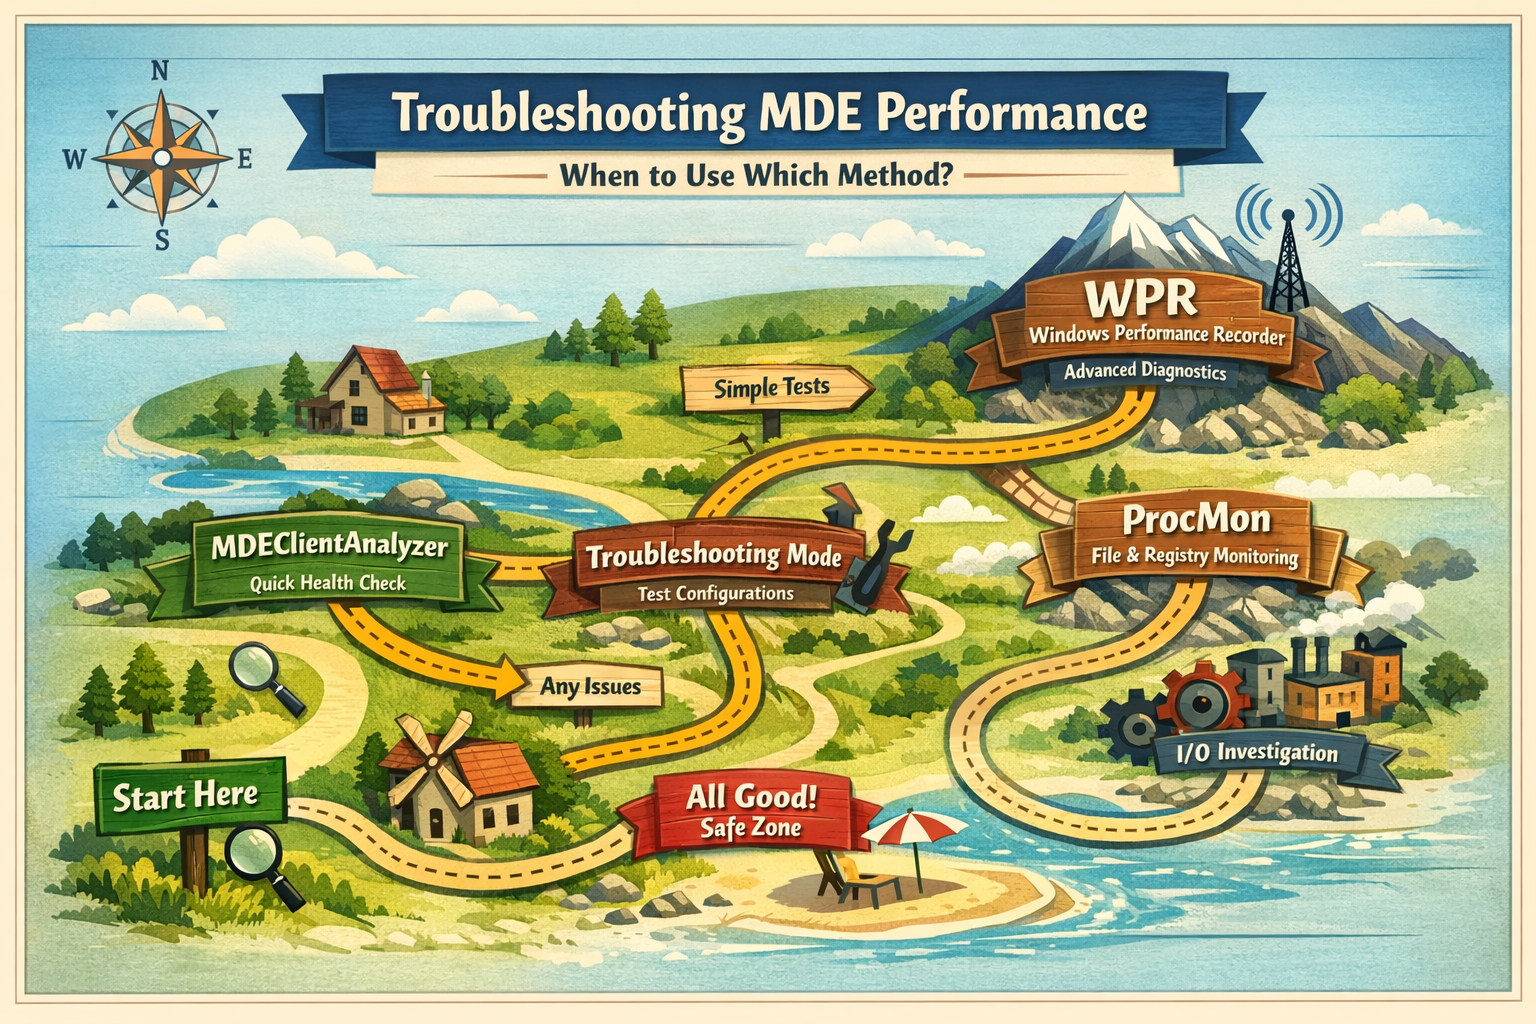
When to Use Which Method?
Troubleshooting Mode is best used when you need to temporarily bypass tamper protection and test configuration changes. It’s ideal for validating policies, testing exclusions, or quickly adjusting Defender settings without permanently weakening security controls. Think of it as a safe way to “experiment” in a controlled manner.
Defender Performance Recording is the most powerful option, but also the most complex. It’s typically used for deep performance investigations, such as high CPU usage, memory issues, or system-wide slowdowns caused by Defender. Because it captures low-level system activity, it’s best suited for advanced troubleshooting or when other tools don’t provide enough insight.
MDEClientAnalyzer is the go-to tool for quick health checks and common issues. It analyzes Defender-related logs and configurations, helping you identify misconfigurations, update problems, or general client health issues. It’s easy to run and should usually be your first step before diving deeper.
Process Monitor (ProcMon) is particularly useful for analyzing file system and registry activity. It’s easier to use than WPR for I/O-related investigations, such as identifying which files or paths Defender is accessing or scanning. However, since it’s already widely known among sysadmins, it’s often used as a complementary tool rather than a primary focus.
Troubleshooting Maps, how I would recommend you starting to troubleshoot:
⚠️ Disclaimer
The configurations shared in this post reflect my personal approach. It provides best practices and recommendations only and comes without any liability. Always align them with your enterprise security strategy.
Happy configuring! 😊


